Particle sizes of chocolate and chocolate products strongly influence the mouth feel of the chocolate product — a very small particle size would produce a “smooth” sensation in the mouth. To achieve the desired quality not only the careful testing of final products, but also the monitoring of the production process is mandatory.
Analysis of three different chocolate types
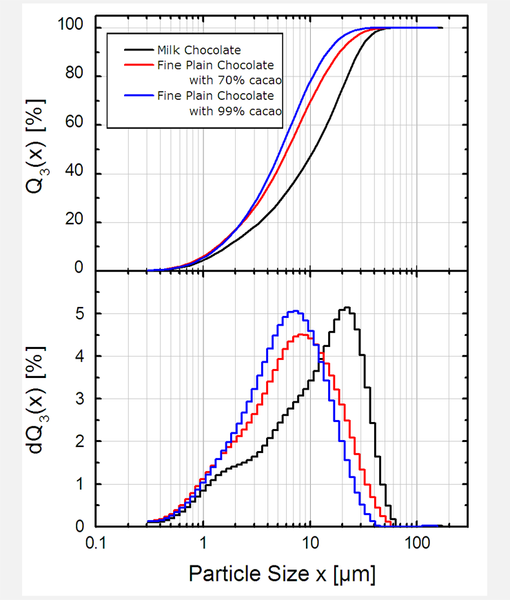
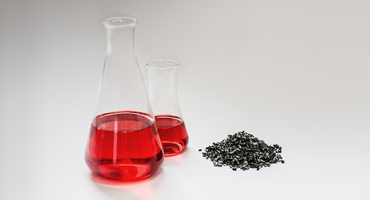
The particle size distributions of different types of high quality chocolate from the same producer were measured using a FRITSCH ANALYSETTE 22. Prior to the measurement, the chocolate samples where pre-dispersed in an organic solvent.
Pictured on the left are: the cumulative curve distribution Q3(x) - (top), as well as the histogram dQ3(x) - (bottom), meaning the volume share per particle size interval of the different chocolate types visible.
The very fine distribution of the chocolate with a cocoa share of 99 %, results in a very intensive taste and an almost “sticky” mouth feel.
Visible differences

Significant differences are visible: the chocolate with a large fraction of cocoa does have a much finer particle size distribution than e.g. milk chocolate. This leads to a very smooth and sometimes even sticky sensation what in turn yields a very intensive taste. Higher content of sugar as in milk chocolate typically results in a particle size distributions that is shifted toward larger particles.
In the density distribution a peak around 20 μm is dominant, but still more than 95 % of the sample material is found in particles smaller than 30 μm. Less critical for the mouthfeel is the higher upper limit of the particle sizes caused by the sugar crystals since they quickly dissolve in the mouth.
Analysis of identical samples
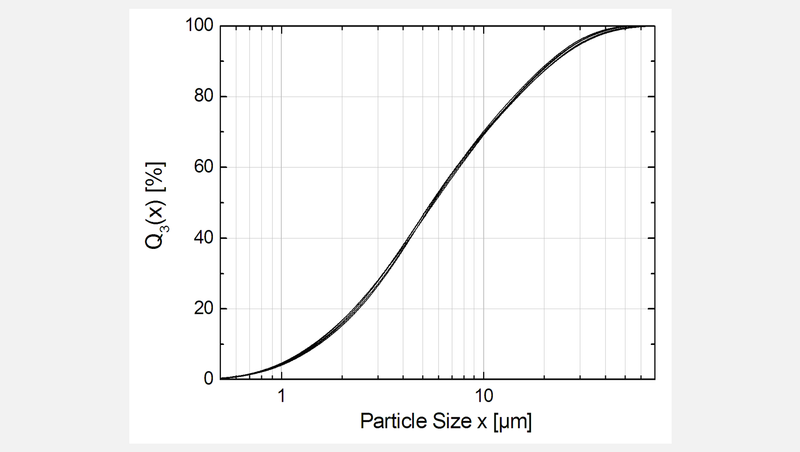
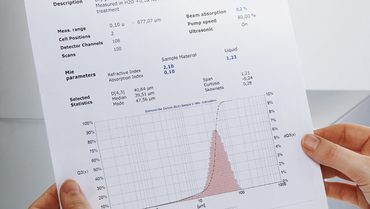
During the measurement of particle size distributions, reproducibility is of major interest. Picture 2 shows the cumulative curve distributions Q3(x) of 5 consecutive measurements of a sample taken from the production process of milk chocolate in order to control the conching process. About 5 g of chocolate were added to a beaker glass and were pre-dispersed in an organic solvent using an external ultrasonic bath. From this beaker glass for each of the ten measurements now a small amount of sample material was added to the small volume wet dispersion unit of the ANALYSETTE 22. After each measurement the dispersion unit was flushed and the system was refilled with solvent for the next measurement.
In conclusion
The small variation of the particle size distribution from measurement to measurement as seen in picture 2 is mainly due to the sampling process: When taking a small amount of material from the beaker glass, the actual distribution will slightly vary. Averaging over several measurements can help to eliminate this effect.
Most important for measuring of chocolate samples is the use of a suitable solvent. Otherwise the high fat content of the chocolate samples will quickly result in a significant contamination of the measurement cell glass.
-
Download the FRITSCH-report as PDF file

FRITSCH GmbH - Milling and Sizing
55743 Idar-Oberstein